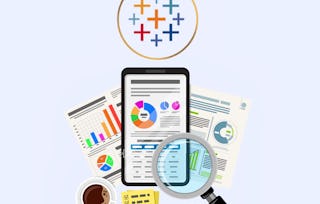
This course introduces the world of business intelligence and visual analytics with Tableau, helping you turn raw data into clear, compelling insights.
You’ll begin by exploring how modern organizations use data to guide decisions and how Tableau fits into today’s analytics landscape. The course familiarizes you with the Tableau ecosystem, its core capabilities, and the workflow that transforms data into meaningful business insights. From there, you’ll move into the practical side of analytics, connecting Tableau to different data sources, preparing and refining datasets with Tableau Prep, and structuring data through effective modeling techniques. These steps establish the foundation needed for reliable and scalable analysis. The course then shifts to the art of visualization. You’ll learn how Tableau represents data visually, how common chart types communicate patterns and trends, and how interactive elements bring analysis to life through dynamic exploration and dashboards. By the end of this course, you will be able to: • Explain the fundamentals of BI and the role of data in organizational decision-making. • Analyze how the Tableau ecosystem transforms raw data into analytical insights. • Connect Tableau to multiple data sources using live connections and extracts. • Prepare and refine datasets using Tableau Prep for reliable analysis. • Build effective data models using joins, unions, and relationships. • Create impactful visualizations and interactive dashboards for data exploration. Designed for aspiring data analysts, business professionals, students, and anyone beginning their analytics journey, this course provides a clear and practical starting point for working with Tableau and modern business intelligence tools. To be successful in this course, learners should have a basic understanding of data concepts and familiarity with spreadsheets such as Excel. Start your journey into data-driven insights and discover how Tableau transforms data into powerful visual stories.